Use this tab to configure the automated statistics output defaults for the ipSentry status reporting. The information provided in this area will be used as the system default. You can override these specifications directly or indirectly using the reference option within each entry if desired.
These settings will be applied to the {default} entry configuration..
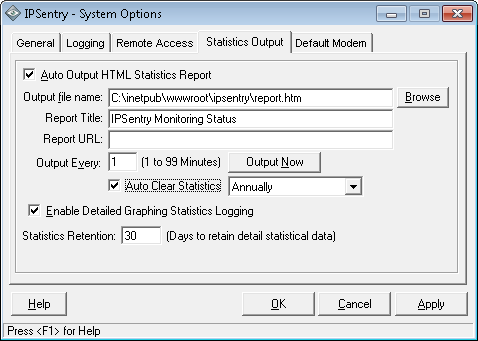
Auto Output HTML Statistics
Report
This option controls whether the auto-generation of statistical reports for
ipSentry will be generated. If this is disabled, no status reports will be
generated regardless of the configurations set at the entry level.
This is a global setting.
Output file name
Select the default file name to which the base status report will be written.
*The base status report no longer contains an auto-refresh option embedded in
the template. For automated status updates, we recommend using the DASH Client
and configuring the DASH Client Access options on the Remote Access tab.
If you desire auto refresh options for the specified reports, we recommend creating a frames based page which automatically refreshes the target frame with the report information and placing that page in the path specified in this field.
For example:
If our report file is named report.html, we can create a file named
refresher.html in the same path. The contents of this page can be quite a
simple page:
<HEAD>
<TITLE>ipSentry - Statistics Requestor</TITLE>
<META http-equiv="refresh" content="30;"></META>
</HEAD>
<FRAMESET COLS="100%" ROWS="1">
<FRAME src="report.html" TARGET="PFRAME"></FRAME>
</FRAMESET>
<FRAMESET COLS="100%" ROWS="100%">
<FRAME NAME="PFRAME"></FRAME>
</FRAMESET>
</HTML>
Now, instead of loading report.html directly, you would load refresher.html
instead and this would auto-refresh the statistics page display every 30
seconds.
If you are writing this out to a location accessible to a web server, you would
then enter the URL to access the refresher.html page in the Report URL field.
Browse
Click this button to browse for a location / file name to which the base report
will be written.
Report Title
Enter the title of the report you wish to have displayed in the base report.
This option is intended to identify the entries within the report as a report
group and can be customized at the monitored device level and allows you to set
the title based on the grouping functionality that you are using for report
generation.
Report URL
When writing the report to a location which is accessible to a web server, this
URL will be the link placed in the table of contents file that is built locally
during a report view request and can be utilized when customizing your report
pages by modifying the .HTI templates. Basically, this will be the URL to
obtain the specified report index from a location other than the ipSentry
machine.
Output Every
Enter the minimum number of minutes that should elapse before a new report is
created and output to the specified location.
Output Now
Click this button to build the output reports. You will be presented with
the local TOC which contains all defined report locations.
Auto Clear Statistics
When selected, ipSentry will clear the basic Up/Down statistics used to generate
the simple HTML statistics report according to the selected frequency. You
can select to clear the stats every day, on a specific day of the week, each
month, or once per year. The data will be cleared before the first cycle
is run in the next frequency period. For example, if you select Monthly
then the statistics will be clear on the first monitoring cycle run when the
month has changed. *** The clearing of these statistics does NOT clear or modify
the Detailed Graphing Statistics.
Enable Detailed
Graphing Statistics Logging
This option enables the logging of detailed statistical samples for use with
ipSentry Graphing Tool or for extraction by your own proprietary reporting
modules. Please be aware that enabling detail logging here does not
automatically enable full statistical logging for all devices. Rather, you
must selectively enable detailed logging for each monitored device.
Setting this to enabled will cause only the basic Monitor Action Status and Monitor Action Time to be logged. In order to log more detailed information, you must enabled detailed statistical logging on the devices for which more detailed data is desired.
The data available on each device is dependent on the type of monitored entry
being monitored and is outlined in the help section for the monitored entry
type.
For more information, see ipSentry Graphing Tool.
Statistics Retention
Enter the number of days for which statistical data should be retained.
All data older than this date will be purged from the database on a daily basis
during an idle period between sentry cycles. If you wish to maintain data
for 6 months, then you should enter 186 in order to allow for 6x31 day months of
data. Depending on the amount of detail you have selected, this database
can grow significantly huge over a period of 6 months.